Entry Name: "Purdue University for Mini-Challenge 1"
VAST
Challenge 2016
Mini-Challenge 1
Team Members:
HsinMan Wu, Purdue University, wu949@purdue.edu PRIMARY
XingHe Hu, Purdue University, hu264@purdue.edu
SiYan Liu, Purdue University, liu1690@purdue.edu
Yuankun Song, Purdue University, song340@purdue.edu
Hui Tang, Purdue University, tang227@purdue.edu
Zheng Zhou, Purdue University, zhou85@purdue.edu
Shuang Wei, Purdue University, wei93@purdue.edu
Mingran Li, Purdue University, li1940@purdue.edu
Dr. Yingjie (Victor) Chen, Computer Graphics Technology, Purdue University, victorchen@purdue.edu (supervising faculty)
Dr. Zhenyu (Cheryl) Qian, Interaction Design, Purdue University, qianz@purdue.edu (supervising faculty)
Student Team: Yes
Team Number:
Streaming ID:
Tools Used:
Adobe Photoshop Illustrator
Adobe Flash
Axure RP
Sketch
Adobe Premiere
Approximately how many hours were spent
working on this submission in total?
170 Hours
May we post your submission in the Visual Analytics Benchmark Repository after VAST Challenge 2015 is complete? Yes
High-resolution
image:
Video (Optional but
recommended):
Storyboards
(Optional but recommended):
Description
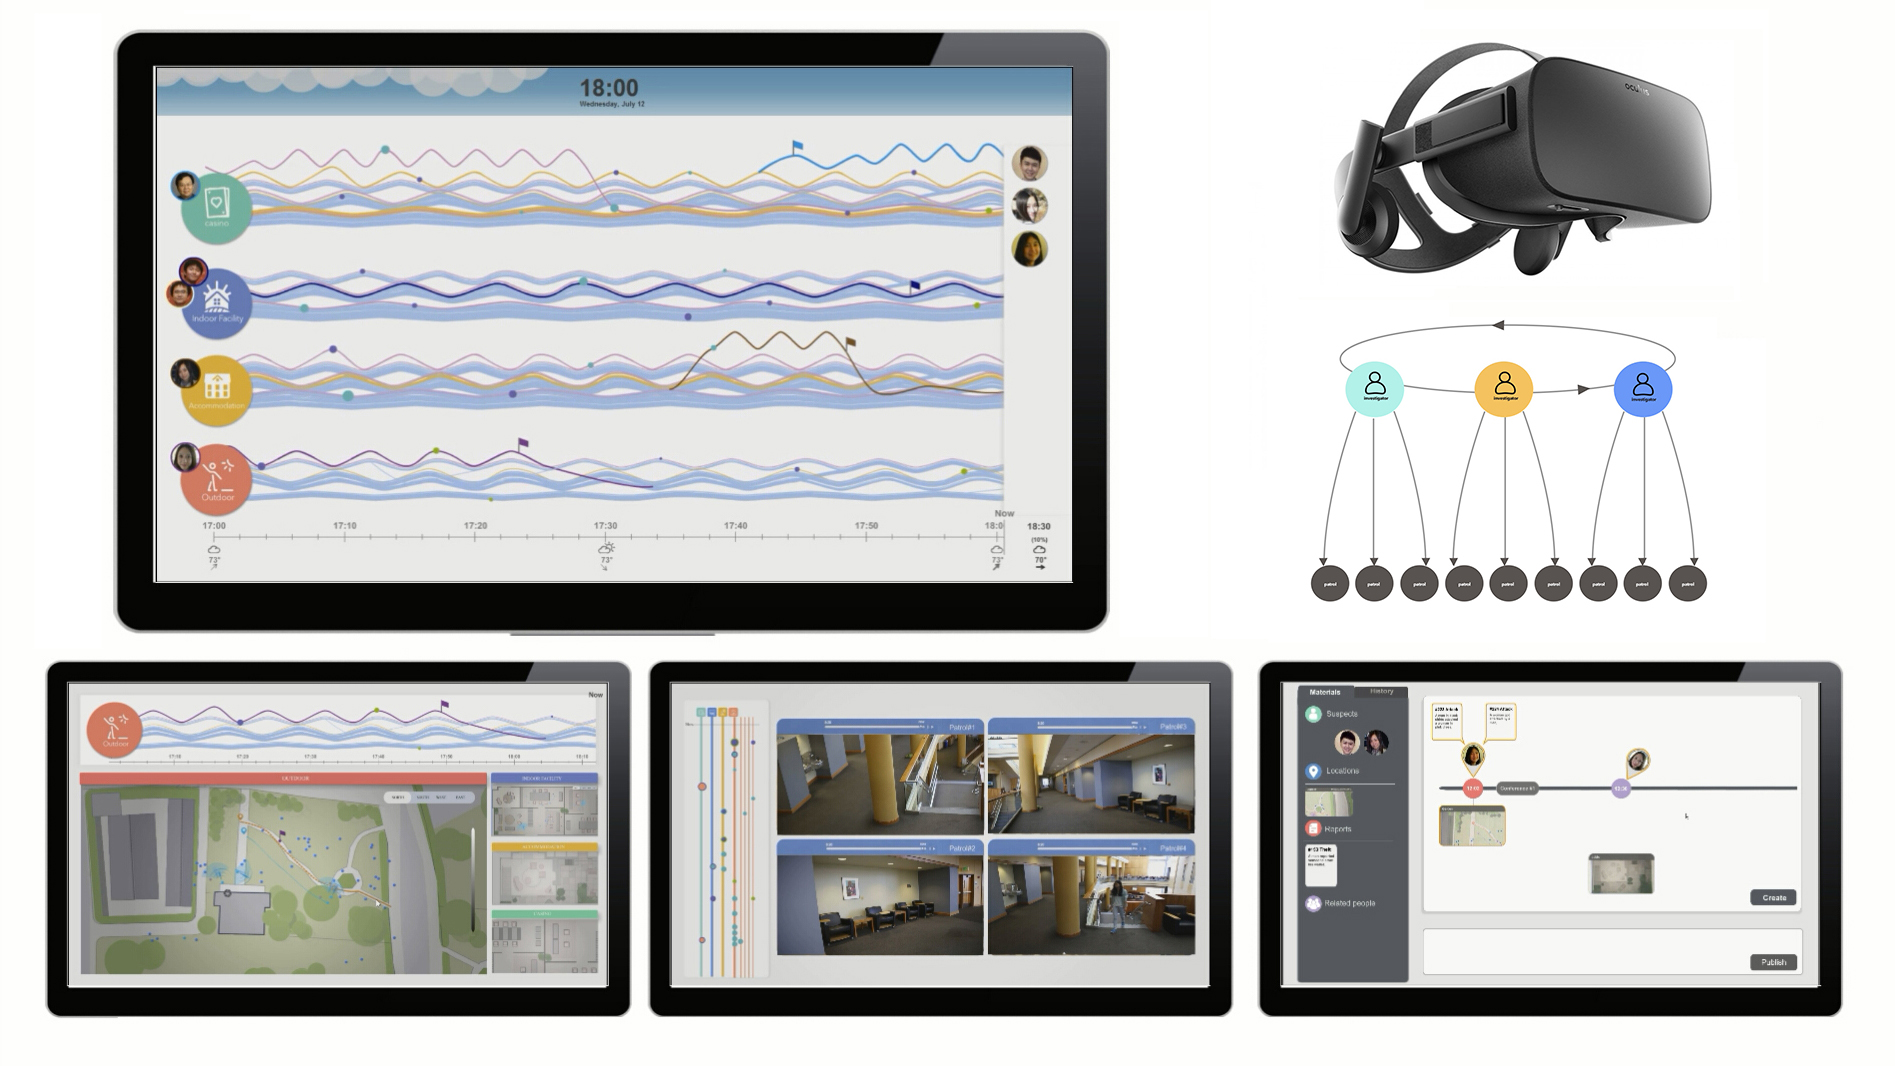
Figure 1. Display Design
1. Display Structure
Our solution was inspired by the idea of Pororoca, the natural tidal bore on Amazon River. Inspired by this natural element, we created a soothing and informative visualization steaming system using concepts of ripples and waves.
The Pororoca system runs on a configuration of a wall display screen in front of the room and three regular screens for every investigator. Each investigator is also equipped with a virtual reality head-mounted display.
Investigators can collaborate with on-site patrols who are equipped with Augmented Reality glasses.
Figure 2. Wall Screen
2. Wall Display Screen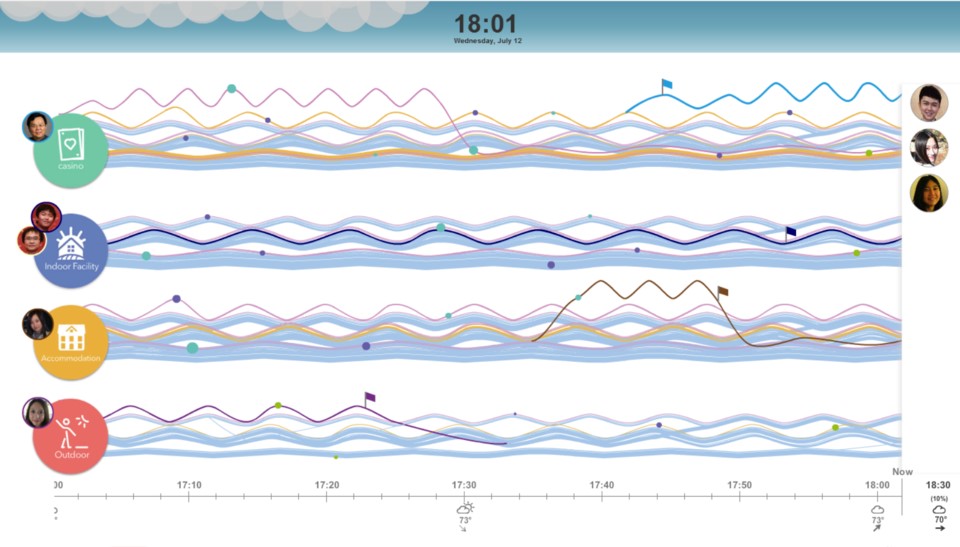
On the wall screen, four running waves present the activity overview of guests in casino, indoor facility, hotel, and outdoor space. With various Internet of Things technologies, the system collects, aggregates and analyzes all guests’ activities and visualizes results as waves.
Colors are used to differentiate types of guests. Slow smooth waves represent people in a kind of peaceful status, while high-frequency waves represent people moving abnormally. People in a similar status are grouped into one stream of thicker wave.
To enable collaboration and situational awareness between investigators, thumbnails on the left indicate areas each investigator is exploring. Investigators can also share their own screens on the main wall display.
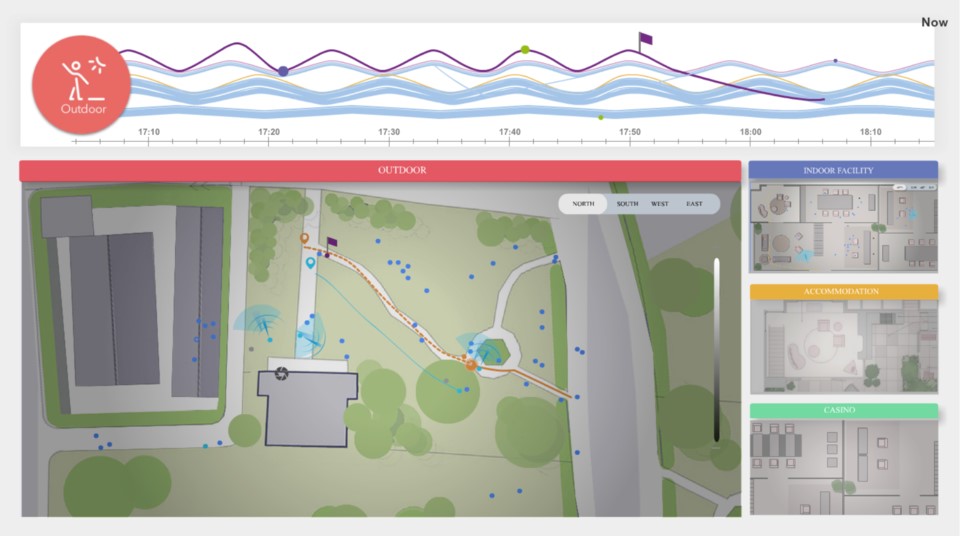
Figure 3. Left Screen
3. Left Screen
Each investigator can choose one wave from the large display to work on through their 3-screen desktop systsem. On the left screen is the overall monitoring interface. Investigators can also switch among different areas by clicking the maps on the right side.
Sectors around dots of patrols represent areas that are within their vision scopes.
Investigators can see past activities of guests through their paths on the map.
By right clicking patrols, investigators can contact them and assign them new tasks. Clicking on patrols can switch to the first-person view of them in the VR glasses. The dots on the curves represent key reports from security officers.
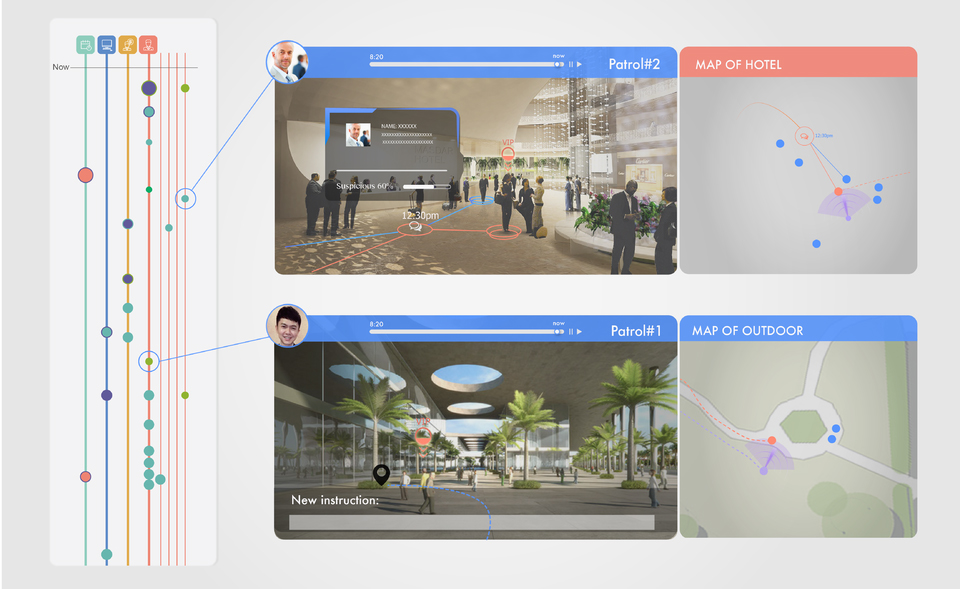
Figure 4. Middle Screen
4. Middle Screen
On the middle screen is the interface for detailed investigation. On the left there are four thicker report lines with dots that represent reports and scheduled events. Thinner lines represent suspicious individuals. The four video windows are from onsite patrol or suvilliance video camera. Using auto-detection and augrmented reality, the patrol can see the targets movement traces and the locations of where they have meet with somebody. Investigators can check reports in the first person view of patrols by clicking on the dots to rapidly get awareness of what is happening. Also investagors can send commands to the patrol to ask them check specific points.
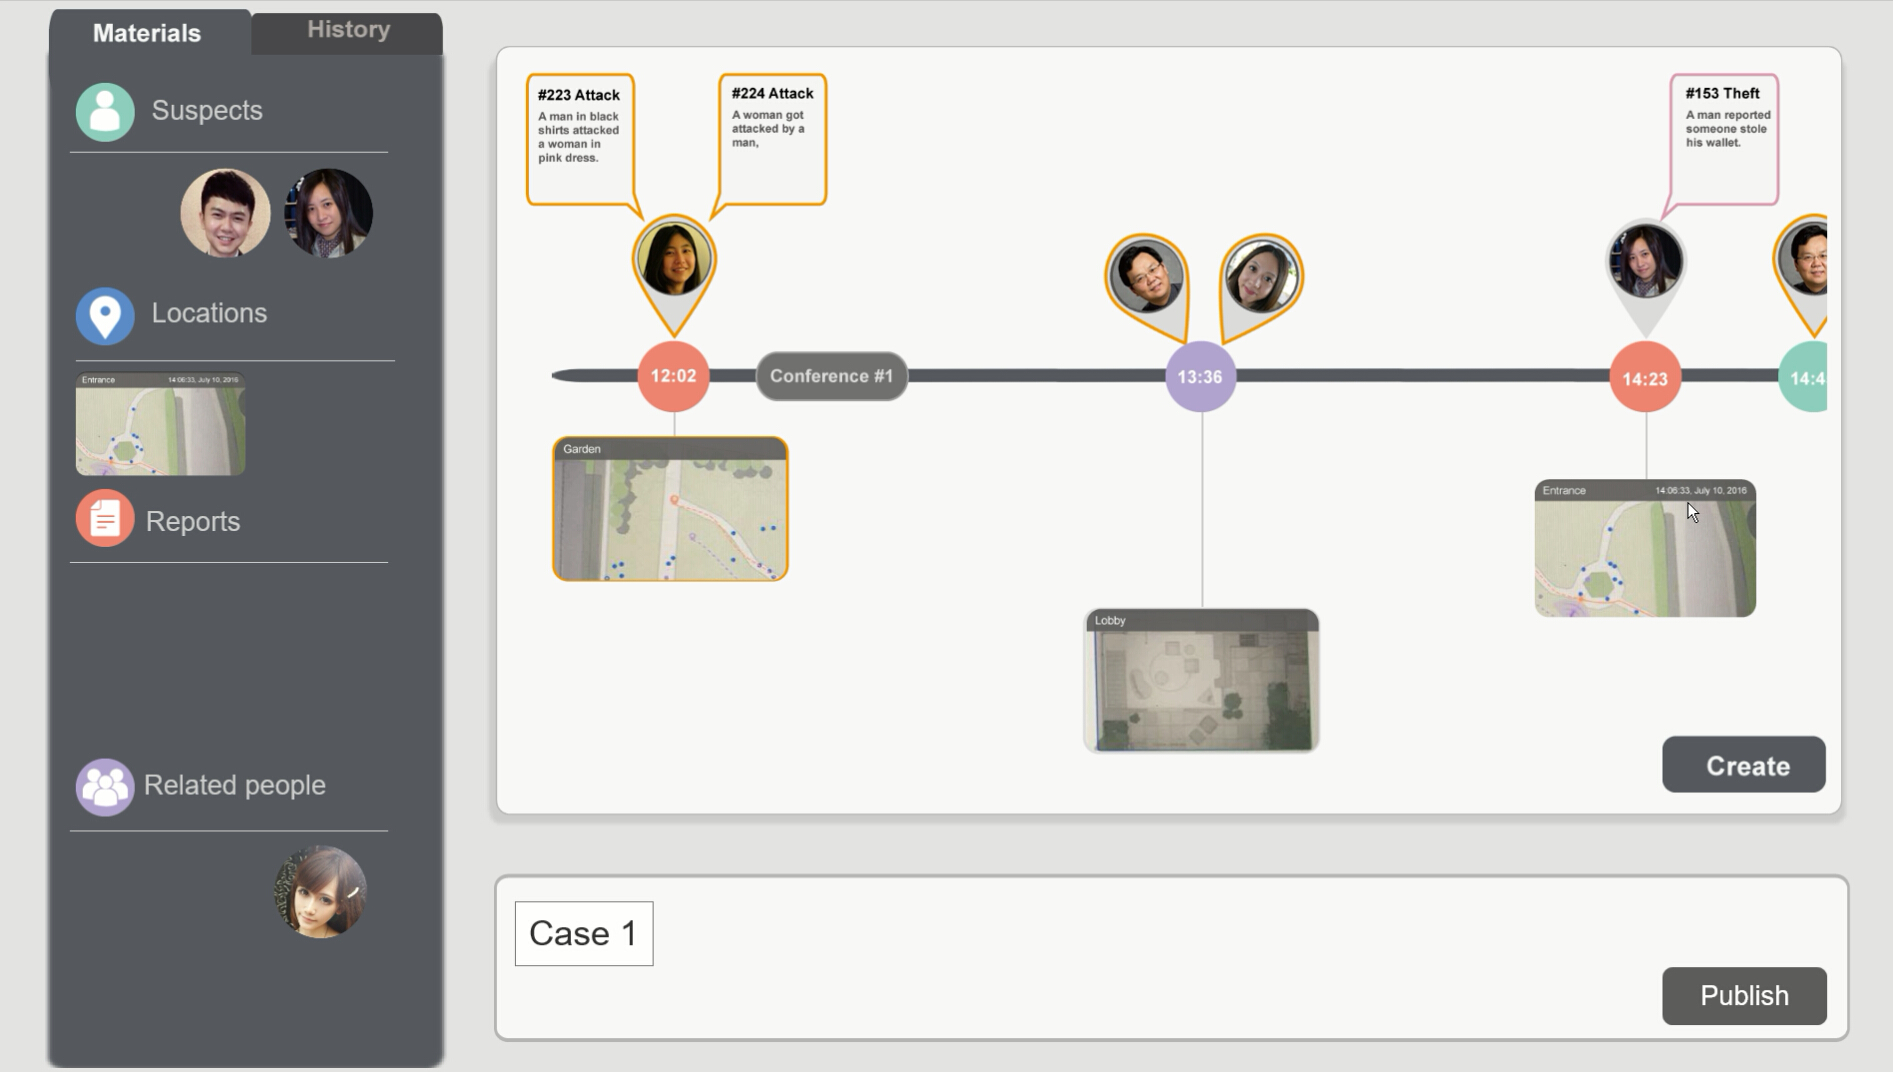
Figure 5. Right Screen
5. Right Screen
On the right screen is the case builder. The left bar contains suspicious people, locations, reports and networks of suspects that are marked in previous steps. Any event/person reported by onsite patrols will be collected into the repository. System automatically retrive necessary information from other datasets, for example, some details about people involved in an event reported by a newspaper article. Investigators can also add resources here. These objects contain rich information about four major elements of a case – times, locations, people and stories. By dragging objects into the panel on the right, these elements contained in objects will be automatically extracted and organized by the system to build a story.